Unlocking Potential: Using Fibonacci in Forex Trading Strategies
Forex trading offers exciting opportunities for traders to profit from fluctuations in currency exchange rates. Popular tools that many successful traders employ are Fibonacci retracement and extension, a technique derived from the Fibonacci number sequence. This article delves into the intriguing world of Fibonacci in forex trading, explaining its significance, and highlighting profitable trading strategies.
Understanding Fibonacci Numbers
Fibonacci numbers are a fascinating sequence named after the Italian mathematician Leonardo Fibonacci, who introduced it to the western world. The sequence begins with 0 and 1, and each subsequent number is the sum of the two preceding ones (e.g., 0, 1, 1, 2, 3, 5, 8, 13…). These numbers exhibit unique mathematical properties that can be observed in various natural phenomena and, interestingly, financial markets. To explore more about forex trading strategies, including those that might complement Fibonacci tools, visit our Forex Strategies page.
The Intersection of Fibonacci and Forex
Fibonacci numbers translate into several ratios, with the most important being 23.6%, 38.2%, 50%, 61.8%, and 100%. These percentages arise from the relationship within the Fibonacci sequence. For example, any number in the sequence is roughly 61.8% of the next number and approximately 38.2% of the number after the next one.
In forex trading, these Fibonacci ratios are interpreted as retracement and extension levels – points where the price might reverse after a price movement. Traders utilize these levels to forecast potential price changes and to plan their trading strategy accordingly.
Fibonacci Trading Tools
The beauty of Fibonacci in forex trading lies in its versatility. Traders use Fibonacci levels to identify potential support and resistance levels, plan entry and exit points, and set stop-loss orders. One common strategy is to combine Fibonacci retracements with trendlines to identify potential reversal points in trending markets.
Fibonacci retracement is a popular tool among traders, used to identify potential levels of support and resistance in the price action of financial markets.
How to Use Fibonacci Retracement Tool in Trading
- Identify Significant Price Moves: The first step is to identify a significant price move, either up or down. This could be a trend or a major peak or trough on the price chart.
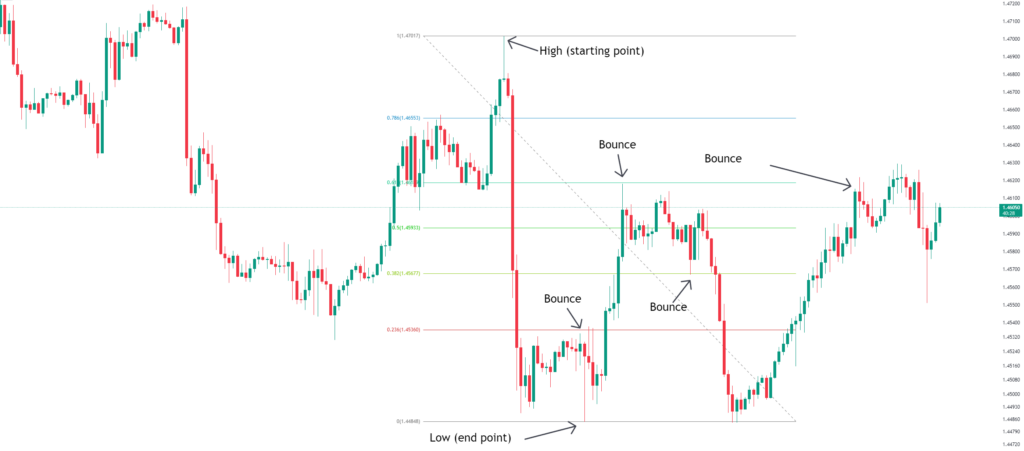
- Draw Fibonacci Levels: Using the Fibonacci tool on your trading platform, draw a line from the start point (the swing low) to the end point (the swing high) of the price move for an uptrend. For a downtrend, you would draw from the swing high to the swing low. The software will automatically divide the vertical distance by the key Fibonacci ratios and plot the resulting levels on the chart.
- Identify Potential Support and Resistance Levels: The plotted levels are where traders anticipate potential support or resistance. In an uptrend, traders watch these levels for the price to pull back before going up again (retracing). In a downtrend, these levels could be where the price bounces back up before falling again.
- Plan Your Trade: Traders typically use these levels to plan their trades. They may enter a ‘buy’ order if the price retraces to a Fibonacci level in an uptrend or a ‘sell’ order in a downtrend. They might also use these levels to place stop loss orders or to take profits.
For practical application of these tools, you can use platforms like TradingView, which offers advanced charting tools, including Fibonacci retracement and extension tools. Learn more and access these tools on TradingView.
However, it’s essential to remember that no tool is foolproof. While Fibonacci retracement can be a powerful tool in a trader’s arsenal, it’s not always accurate and should be used in conjunction with other indicators, along with the price movement itself, and proper risk management techniques.
Fibonacci extensions are a tool that traders use to identify potential levels where the price might find support or resistance, particularly during a trend. They are based on the same mathematical principles as Fibonacci retracements – the Fibonacci number sequence – but they are used to forecast the potential price movement beyond the original price range, often following a retracement.
The key Fibonacci extension levels are 100%, 127.2%, 141.4%, 161.8%, 200%, and 261.8%. These percentages are applied to the price range to project how far the price might move after bouncing from a retracement level.
For a deeper understanding of how Fibonacci tools can be combined with other chart patterns, check out our guide on Mastering the Art of Forex Chart Patterns.
How to Use Fibonacci Extension Tool in Trading
- Identify Significant Price Moves: The first step is to identify a major price move, either up or down. This could be a trend or a major peak or trough on the price chart.
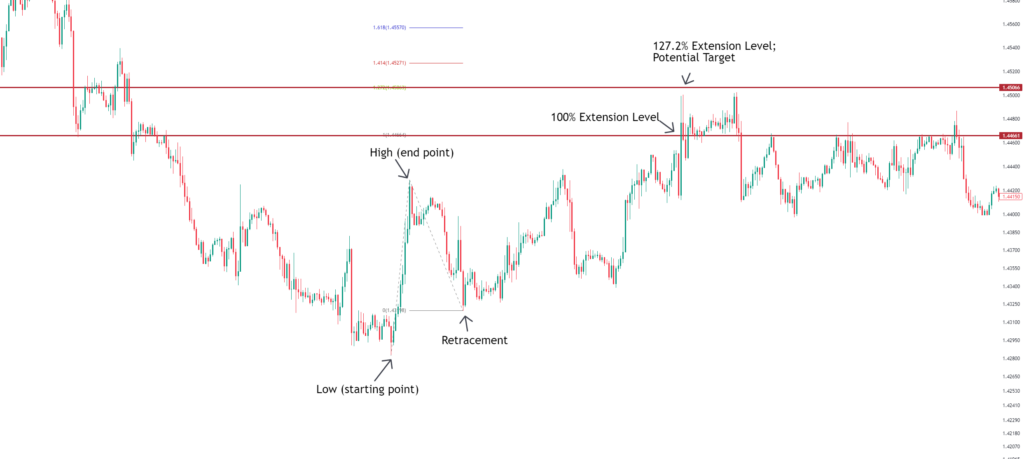
- Draw Fibonacci Levels: With the Fibonacci tool on your trading platform, draw a line from the swing low to the swing high and back down to the retracement point for an uptrend. For a downtrend, you would draw from the swing high to the swing low and back up to the retracement point. The software will automatically calculate the extension levels from the retracement point.
- Identify Potential Support and Resistance Levels: The plotted levels are where traders anticipate potential support or resistance. Traders watch these levels for the price to potentially stall or reverse.
- Plan Your Trade: Traders typically use these levels to plan their trades. They might place a ‘take profit’ order at a Fibonacci extension level, anticipating that the price might reverse at this point.
Why Traders Use Fibonacci Tools
Traders use the Fibonacci extension tool for several reasons:
- Predictive Ability: Fibonacci extensions are used to forecast potential price targets. This can help traders plan their exit points for their trades.
- Versatility: The Fibonacci extension tool can be used across different timeframes (from intraday to long-term charts) and in various markets, including stocks, commodities, forex, and cryptocurrencies.
- Combination with Other Tools: Fibonacci extensions can be combined with other technical analysis tools (such as Fibonacci retracements, trendlines, or moving averages) to validate trading decisions and improve their accuracy.
Benefits of Using Fibonacci Tools
- Objective Analysis: The Fibonacci extension tool provides an objective way to identify potential price targets. It’s based on mathematical principles rather than subjective judgment.
- Profit Maximization: By providing potential exit points, Fibonacci extensions help traders maximize their profits by allowing them to anticipate where the price might reverse.
- Risk Management: Fibonacci extensions also aid in risk management by helping traders set their profit targets and manage their trade expectations effectively.
As with Fibonacci retracements, it’s important to remember that while Fibonacci extensions can be useful, they are not always accurate and should be used alongside other indicators and sound risk management techniques.
Fibonacci in Your Trading Strategy
Incorporating Fibonacci retracement and extension tools into a trading strategy involves using these tools to identify potential levels of support and resistance, and then using these levels to make trading decisions. Here’s a step-by-step guide on how you could incorporate these tools into a trading strategy:
- Identify the Trend: Start by identifying the overall trend. Are prices generally moving upwards (an uptrend) or downwards (a downtrend)? Fibonacci tools are typically used in conjunction with trend trading strategies, so it’s essential to understand the broader trend.
- Draw Fibonacci Retracement Levels: Once you’ve identified a significant price move that aligns with the overall trend, draw Fibonacci retracement levels. For an uptrend, draw the levels from the swing low to the swing high. For a downtrend, draw from the swing high to the swing low.
- Wait for a Retracement: Look for the price to retrace to one of the Fibonacci levels. These levels often act as support or resistance, where the price could potentially bounce and resume the original trend.
- Confirm with Other Indicators: Use other technical analysis tools to confirm the potential trade. This could include candlestick patterns, oscillators (like RSI or MACD), or chart patterns. The goal is to look for confirmation that the price is likely to resume the original trend.
- Enter the Trade: If the price action and other indicators suggest that the price will resume the original trend, consider entering a trade. In an uptrend, this would be a buy order. In a downtrend, a sell order.
- Use Fibonacci Extension Levels to Set Take-Profit Points: Draw Fibonacci extension levels to identify potential levels where the price may reverse. Traders often set their take-profit order near these levels.
- Set a Stop-Loss Order: As with any trading strategy, it’s crucial to manage your risk. Set a stop-loss order at a level that aligns with your risk tolerance. This could be just below (in an uptrend) or above (in a downtrend) the Fibonacci level where you entered the trade.
- Manage the Trade: Monitor the trade and adjust your stop-loss and take-profit orders as needed. If the price breaks through a Fibonacci level, it might move towards the next level.
Remember, no trading strategy is perfect, and Fibonacci tools are not always accurate. It’s essential to use them in conjunction with other forms of technical analysis and to always use a risk management strategy to protect against potential losses.
Advantages and Risks of Using Fibonacci in Forex
The advantages of using Fibonacci in forex are numerous. It provides objective, mathematical levels that can be applied across various timeframes and currencies. They offer traders clear entry and exit points and can be combined with other technical analysis tools for enhanced accuracy.
However, like any trading strategy, using Fibonacci isn’t without risks. Key among these is the potential for false signals, which can lead to losses. It’s essential to use Fibonacci in conjunction with other indicators and to employ rigorous risk management to protect your trading capital.
Fibonacci tools come with their own set of advantages and risks.
Advantages of Using Fibonacci Tools:
- Predictive Insights: Fibonacci tools can provide traders with predictive insights about potential price levels that could serve as support or resistance.
- Flexibility: Fibonacci tools are versatile and can be applied to different markets (stocks, forex, commodities, etc.) and various timeframes, from intraday to long-term charts.
- Risk Management: They can help with risk management by identifying levels for stop-loss and take-profit orders.
- Enhanced Decision Making: By providing potential areas of interest on the chart where price might react, they can help traders make more informed decisions.
- Objectivity: Fibonacci tools are based on mathematical relationships and provide an objective method to identify potential price levels, reducing the impact of human emotions on trading decisions.
Risks of Using Fibonacci Tools:
- Not Always Accurate: While Fibonacci levels can suggest potential support and resistance levels, they are not always accurate. Price may not respect these levels and could move past them.
- Dependency on User’s Judgment: The effectiveness of Fibonacci tools depends on correctly identifying the swing high and swing low. A wrong selection can lead to inaccurate levels.
- Not Foolproof: Fibonacci tools are not a standalone system. They should be used in combination with other technical analysis tools and indicators to confirm trading signals.
- No Guarantee of Profits: Like all trading tools, Fibonacci tools do not guarantee profits. Traders can still incur losses, especially if they fail to implement proper risk management strategies.
Remember, successful trading involves more than just using the right tools. It also requires understanding market conditions, having a well-thought-out trading plan, and maintaining strict discipline in implementing that plan.
Frequently Asked Questions about Fibonacci in Forex
New traders often have numerous questions about using Fibonacci in forex.
How reliable are Fibonacci retracement and extension levels?
While Fibonacci tools have been proven useful in identifying potential support and resistance levels, they are not foolproof. They should be used in conjunction with other technical analysis tools and indicators. A confluence of several indicators can increase the reliability of a trading signal.
Can Fibonacci tools be used in all types of markets?
Yes, Fibonacci retracements and extensions can be used in all types of markets where price movements occur, including stocks, forex, commodities, and cryptocurrencies.
Can Fibonacci retracement and extension levels predict future price movements?
Fibonacci tools are not predictive in the sense that they can foresee future price movements. They provide levels where the price could potentially find support or resistance. The price may not always react at these levels, and other factors can influence the price.
How do I draw Fibonacci retracement and extension levels?
Fibonacci levels are typically drawn using the Fibonacci tool on your trading platform. For retracements, you draw a line from the swing low to the swing high of a price move for an uptrend and vice versa for a downtrend. For extensions, you draw from the swing low to swing high and back down to the retracement point for an uptrend, and the opposite for a downtrend.
Which Fibonacci levels are most important?
The most commonly used Fibonacci retracement levels are 23.6%, 38.2%, 50%, and 61.8%. For Fibonacci extensions, the most used levels are 61.8%, 100%, and 161.8%. However, the importance of a level can depend on the particular market, timeframe, and the trader’s strategy.
Should I use Fibonacci tools for short-term or long-term trading?
Fibonacci tools can be used for both short-term and long-term trading. They are applicable across various timeframes, from intraday charts to weekly or monthly charts.
What if the price doesn’t reverse at a Fibonacci level?
Fibonacci levels are not always respected by the market. If the price doesn’t reverse at a Fibonacci level, it’s essential to have a risk management strategy in place, like a stop-loss order, to limit potential losses.
How can I improve the accuracy of Fibonacci tools?
To improve accuracy, Fibonacci tools should be used in conjunction with other forms of technical analysis, such as trend analysis, candlestick patterns, or other technical indicators. This can help validate the signals given by the Fibonacci levels.
Conclusion
Mastering the use of Fibonacci in forex trading can be a game-changer, offering potential opportunities for profit and a deeper understanding of market structure. As with any trading strategy, it requires practice, patience, and sound risk management. Fibonacci isn’t a silver bullet, but it can be a powerful tool in your trading arsenal when used correctly.