
Mastering the Art of Forex Chart Patterns
Forex trading, a fast-paced and potentially profitable realm of currency exchange, offers opportunities to skilled traders worldwide. One of the critical components to understanding the Forex market dynamics is the use of chart patterns in forex. These patterns, like unique fingerprints of market behavior, help predict potential price movements and guide traders towards more informed decisions.
Basics of Forex Trading
Forex trading revolves around the constant flux of global currency values. Traders attempt to capitalize on these fluctuations by trading one currency against another, forming what we call a currency pair. Various platforms and brokers facilitate this process, serving as a bridge between individual traders and the vast foreign exchange market.
Understanding Chart Patterns
Chart patterns are visual representations of market movements. Their significance lies in their ability to help trader make a decision on future price directions. Identifying these patterns involves studying the arrangement of price points on a chart to decipher the market’s prevailing sentiment and potential shifts in supply and demand.
Types of Forex Chart Patterns
Chart patterns are broadly categorized into reversal, continuation, and bilateral (non-directional) patterns, each indicating different market scenarios.
A. Reversal Chart Patterns in Forex
Reversal patterns signal a potential change in the market trend. They can be spotted at the peak of an uptrend (signaling a potential bearish reversal) or at the bottom of a downtrend (indicating a possible bullish reversal).
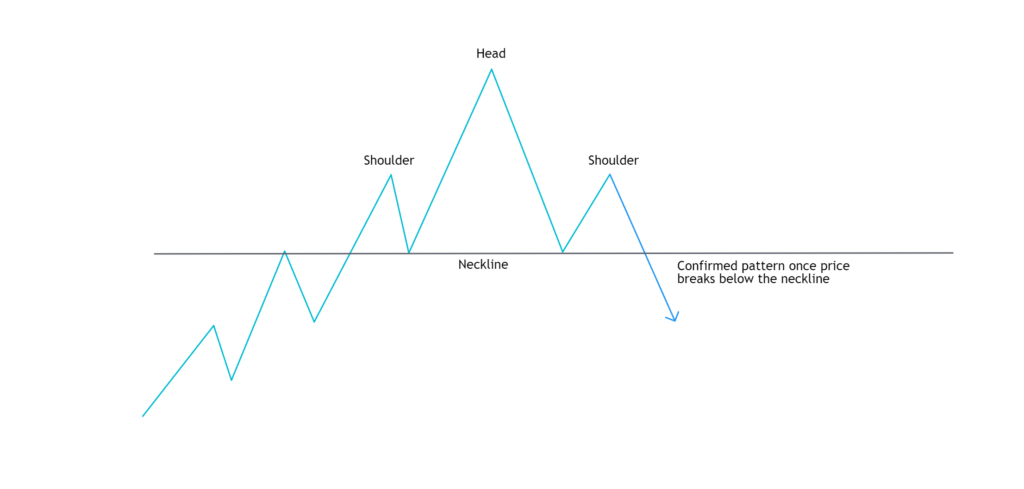
The Head-and-Shoulders (H&S) pattern in trading represents a battle between buyers and sellers, signaling a potential trend reversal.
- Left Shoulder: In an uptrend, buyers push prices up, forming a peak (left shoulder). Prices then fall due to increased selling, creating a trough or neckline.
- Head: Buyers again drive prices up more aggressively, forming a higher peak (the head), but sellers pull prices down to around the neckline.
- Right Shoulder: Buyers push prices up once more, but can only form a peak lower than the head (right shoulder), indicating their diminishing strength.
- Break Below the Neckline: When prices fall and break below the neckline, it confirms the pattern and signals a bearish trend.
Traders “exploit” this pattern by entering short positions once the pattern is confirmed, potentially accelerating the downtrend. However, the pattern doesn’t guarantee success and should be used with other indicators and tools, as well as backtested before trading with real capital.
Scenario: You’re observing GBP/USD during a bullish run and notice an H&S pattern forming. Once the price breaks below the neckline, you enter a short position at 1.4000 with a stop-loss slightly above the neckline at 1.4050. The target may be placed using many tools, such as risk/reward ratio, Fibonacci tools, previous significant price level, and many others.
The Double Top and Double Bottom patterns are common chart patterns that indicate a potential trend reversal in the market. They represent points in the market where the forces of supply (sellers) and demand (buyers) are tested, and the balance begins to shift.
Here’s how these patterns are formed and the market behaviors they exploit:
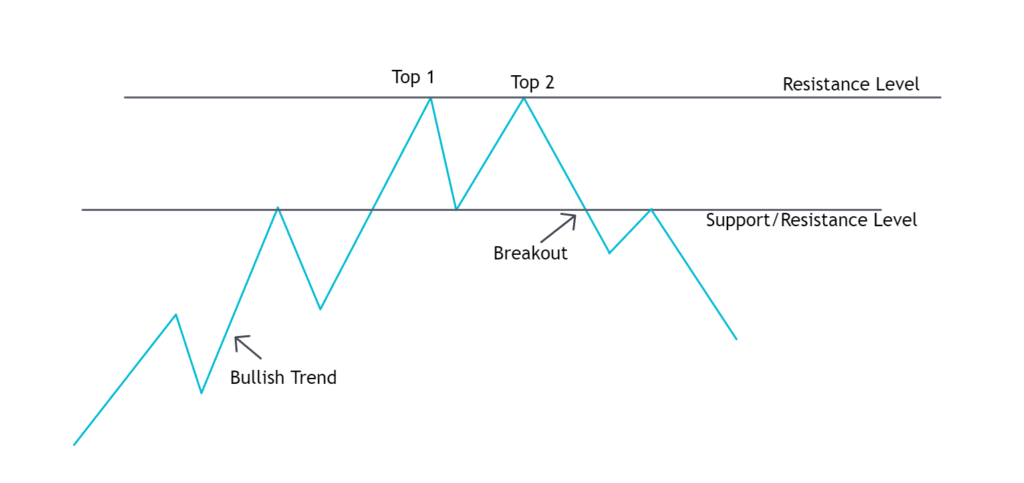
Double Top Pattern:
- First Top: During an uptrend, buyers push the price up until it reaches a point where it meets significant resistance (supply). At this level, the price is more than buyers are willing to pay, and sellers begin to enter the market, pushing the price down.
- Trough: The selling pressure drives the price down to a certain level, forming a trough. At this point, buyers regain control and push the price back up towards the previous resistance level.
- Second Top: The price reaches the previous resistance level, forming a second top, similar in height to the first top. The resistance is too strong, and the price begins to drop again. This double resistance level can be a signal that the buyers are losing control to the sellers.
- Break Below the Trough’s Level: If the price breaks below the level of the trough, it confirms the pattern. The sellers are now in control, indicating a bearish reversal.
Scenario: In a USD/CAD pair on a bullish run, a Double Top forms. You go short when the price breaks below the valley’s level at 1.2700, setting a stop-loss slightly above the recent high at 1.2750.
B. Continuation Chart Patterns in Forex
Continuation patterns indicate a pause in the prevailing trend, followed by a continuation in the original direction.
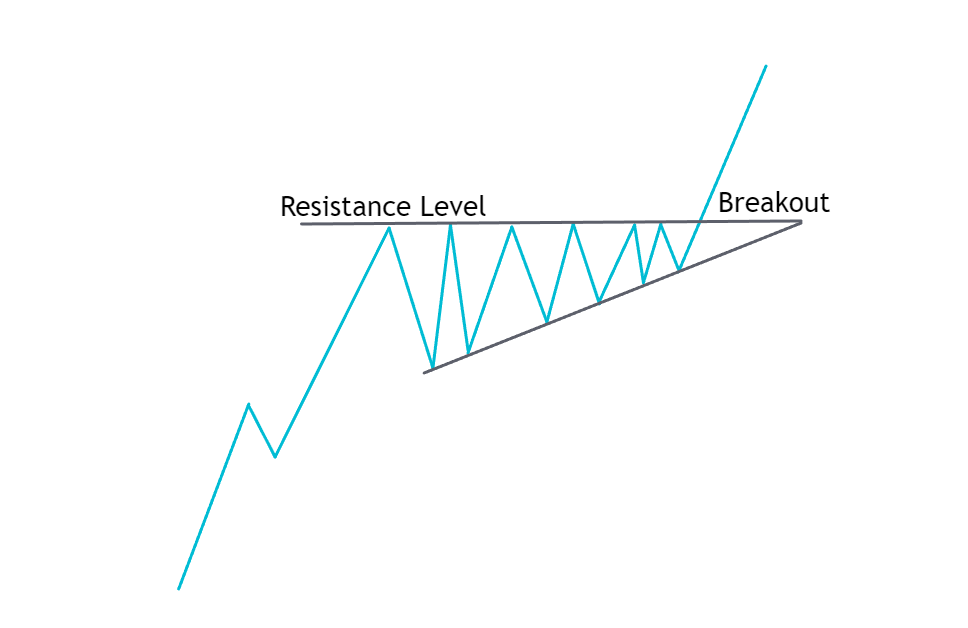
Triangle patterns in trading are commonly observed chart patterns that signal a period of consolidation before a breakout. They’re formed by converging trend lines connecting a series of sequential peaks and troughs. There are three types of triangles: ascending, descending, and symmetrical.
Ascending Triangle:
- Resistance Level: This pattern is identified by a flat resistance line and an upward sloping support line. The price is making higher lows, showing that buyers are more aggressive than sellers.
- Breakout: A breakout above the resistance level indicates that the buyers have won the battle, leading to a bullish trend.
Descending Triangle:
- Support Level: The descending triangle has a flat support line and a downward sloping resistance line. The price is making lower highs, which indicates that sellers are more aggressive than buyers.
- Breakout: A breakout below the support level indicates that sellers have taken control, leading to a bearish trend.
Symmetrical Triangle:
- Converging Lines: In a symmetrical triangle, the price makes lower highs and higher lows. This shows that both buyers and sellers are becoming less aggressive, leading to an increasingly narrow trading range.
- Breakout: The breakout direction is unknown until it happens. Once it does, it’s a signal of the market’s new direction.
In all these cases, traders trade the triangle pattern by anticipating the breakout and positioning themselves accordingly. If it’s an ascending triangle, they prepare for a potential long position, expecting a bullish breakout. If it’s a descending triangle, they get ready for a short position, predicting a bearish breakout. In a symmetrical triangle, they wait to see the breakout direction before deciding on the trade.
However, it’s essential to note that, as with any trading pattern, the triangle patterns are not foolproof. They should be used in combination with other indicators and risk management tools for a more balanced trading approach.
Scenario: USD/JPY has been in a downtrend, but higher lows suggest an ascending triangle pattern. After the price breaks the upper trendline, you enter a long position at 105.50 with a stop-loss at the most recent low, 105.00.
Wedges are trend reversal patterns in technical analysis. They are formed by price movements that contract into a narrower range (forming a wedge shape) over time and signal a pause in the current trend. There are two types of wedge patterns: rising wedges and falling wedges.
Rising Wedge:
- Formation: A rising wedge is formed when the price records higher highs and higher lows with a contracting range. This means that the lower trendline is steeper than the upper trendline. Even though there’s an uptrend, the rate of ascent is slowing down, indicating a potential bearish reversal.
- Breakout: When the price breaks below the lower trendline, it confirms the bearish reversal. The rising wedge is an indication that the buyers are losing control to the sellers.
Falling Wedge:
- Formation: A falling wedge, on the other hand, is formed when the price records lower highs and lower lows with a contracting range. This means that the upper trendline is steeper than the lower trendline. Despite the downtrend, the rate of decline is slowing down, indicating a potential bullish reversal.
- Breakout: A breakout above the upper trendline confirms the bullish reversal. The falling wedge shows that sellers are losing control to the buyers.

Traders “exploit” these patterns by taking positions that align with the expected trend reversal. If it’s a rising wedge, they might consider taking a short position upon the breakout, predicting a bearish reversal. If it’s a falling wedge, they might look to take a long position, expecting a bullish reversal.
However, it’s crucial to remember that, like all trading patterns, wedges do not provide surefire predictions. They should be used alongside other technical analysis tools and indicators to ensure more robust and risk-mitigated trading strategies.
Scenario: A Falling Wedge emerges in the EUR/GBP pair during a downtrend, hinting at a bullish reversal. After the price breaks the wedge’s upper trendline, you enter a long position at 0.8600 with a stop-loss at the recent low, 0.8580.
C. Bilateral Chart Patterns in Forex
Bilateral patterns signal a potential breakout in either direction.
Flags and Pennants are short-term continuation patterns that represent brief consolidations before the previous trend resumes. These patterns are usually preceded by a steep, almost vertical price move, known as the “flagpole” or “mast”.
Flag Pattern:
- Formation: A flag pattern is characterized by a rectangular shape formed by two parallel trendlines during a period of consolidation. The flag can be sloping up, down or be horizontal.
- Breakout: The breakout occurs when the price exits the flag area, typically in the same direction as the previous trend. This represents a continuation of the trend.

Pennant Pattern:
- Formation: Pennants are small symmetrical triangles that begin wide and converge as the pattern matures. Like flags, pennants are also preceded by a sharp price movement.
- Breakout: The breakout occurs when the price exits the pennant formation in the direction of the preceding trend, indicating a continuation of the trend.
As traders recognize the formation of these patterns, they might expect the price to continue in the direction of the previous trend after the brief pause, and thus position themselves accordingly.
For both flags and pennants, the “flagpole” or “mast” serves as a measure to estimate the potential future price movement. Traders often project this distance from the point of breakout to determine the price target.
However, like any other trading pattern, flags and pennants don’t provide foolproof predictions.
Scenario: In the AUD/NZD pair, a flag pattern forms during a bullish trend. After the price breaks above the flag’s upper trendline, you enter a long position at 1.0800 with a stop-loss at the flag’s lower trendline, 1.0780.
Specific Trading Methods Using Chart Patterns in Forex
Different patterns can form the basis of specific trading methods.
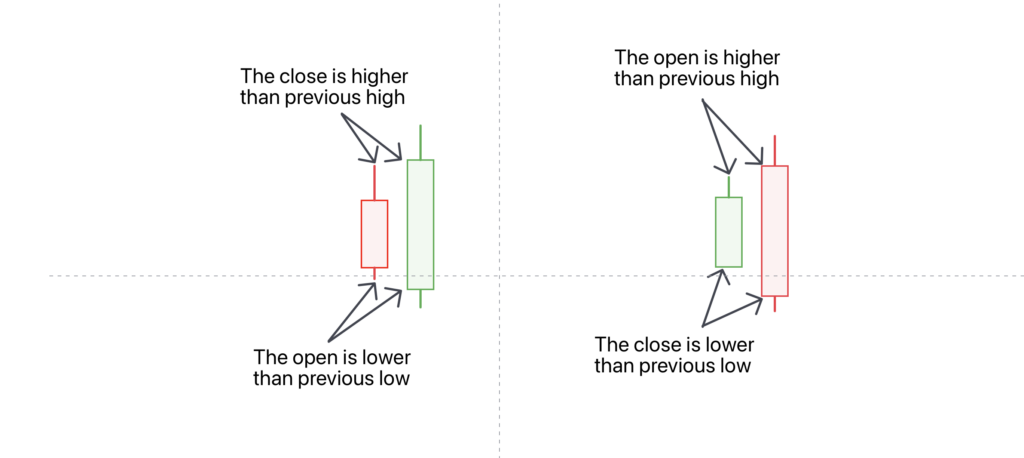
The Engulfing pattern is a key pattern in technical analysis which occurs when a single candlestick ‘engulfs’ or overshadows the range of the previous candlestick. There are two types: Bullish Engulfing and Bearish Engulfing.
Bullish Engulfing Pattern:
- Formation: It occurs at the end of a downtrend. The first candlestick is bearish (with a lower closing price than its opening price). The second candlestick is bullish (with a higher closing price than its opening price), and it ‘engulfs’ the first candle, meaning it opens at a lower price than the first candle’s close and closes at a higher price than the first candle’s open.
- Implication: This pattern implies that buyers have overcome sellers and have taken control, signaling a potential upward price reversal.
Bearish Engulfing Pattern:
- Formation: It forms at the end of an uptrend. The first candlestick is bullish, while the second one is bearish and its range completely engulfs the first one.
- Implication: This pattern indicates that sellers have overcome the buyers and have taken control, signaling a potential downward price reversal.
In terms of market participant behavior being ‘exploited’, the Engulfing pattern is a visual representation of a change in market sentiment. The ‘engulfing’ nature of the second candlestick shows a strong shift in the balance of power between buyers and sellers. Traders leverage this change in market sentiment to potentially anticipate and profit from the impending price reversal.
However, it’s important to remember that, as with all trading patterns, the Engulfing pattern doesn’t guarantee a trend reversal. It’s more reliable when used in conjunction with other technical analysis tools and indicators, and when considering the wider market context.
Scenario: A bullish engulfing pattern forms on the EUR/USD pair after a downtrend. When the green candle closes above the red one, you enter a long position at 1.1800 and set a stop-loss at the green candle’s low, 1.1780.
Creating a Personal Trading System
Choosing a winning chart pattern is only part of the game. To be a successful trader you need a full trading system just for you. A unique trading system comprises different patterns and methods fine-tuned to the trader’s preferences. This system should incorporate backtesting strategies to validate its effectiveness and be flexible enough to accommodate market changes.
Practicing trading and maintaining discipline are key to mastering a personal trading system. Traders should strive to continually refine their strategies and learn from their experiences to optimize their success.
Conclusion
The importance and usage of chart patterns in forex trading cannot be overstated. These tools offer valuable insights into market trends and potential reversals, enabling traders to make calculated decisions and to put odds in their favor.
The world of forex trading demands constant learning and adaptation. Remember, each trader’s journey is unique. While a certain strategy may work for one, it might not for another. Therefore, cultivating your own strategies and staying disciplined is paramount. A good mentor can guide you along this path and help you become a proficient trader.
In the words of the renowned Wall Street trader, Jesse Livermore, “The game of speculation is the most uniformly fascinating game in the world. But it is not a game for the stupid, the mentally lazy, the man of inferior emotional balance, or the get-rich-quick adventurer. They will die poor.” So, keep learning, keep improving, and may the charts be with you.